


Understanding your spirometry test results
Kuopio, Finland
February 20, 2024
Spirometry is a critical tool for assessing lung health, particularly for diagnosing, managing, and monitoring conditions such as asthma, chronic obstructive pulmonary disease (COPD), and other respiratory ailments 1. This article focuses on demystifying the spirometry test results, helping you understand the key metrics and their implications for your lung health and treatment strategy.
Key spirometry test metrics
Understanding your spirometry test results is crucial for managing your respiratory health. The test measures several important lung function metrics, which include:
- FEV1: Forced Expiratory Volume in one second
FEV1 measures the amount of air you can forcefully exhale in one second. It’s a critical indicator of lung function 2. A lower than normal FEV1 can suggest blockages or restrictions in the airway. For example, individuals with asthma may have a reduced FEV1 due to narrowed airways.
- FVC: Forced Vital Capacity
FVC represents the total amount of air you can exhale forcefully after taking the deepest breath possible. This measurement helps in assessing the overall capacity of your lungs. A decreased FVC value might indicate restricted lung function or the presence of a lung disease 3.
- FEV1/FVC ratio
The FEV1/FVC ratio is used to differentiate between obstructive lung diseases, where expelling air quickly is a challenge, and restrictive diseases, where lung capacity is diminished. In healthy adults, this ratio should typically be approximately 75-80%. A lower ratio suggests obstructive lung disease, such as COPD, whereas a normal or high ratio with reduced FEV1 and FVC values may indicate a restrictive lung condition 4.
- PEF: Peak Expiratory Flow
Measures the highest speed at which you can exhale, offering insights particularly relevant for asthma management.
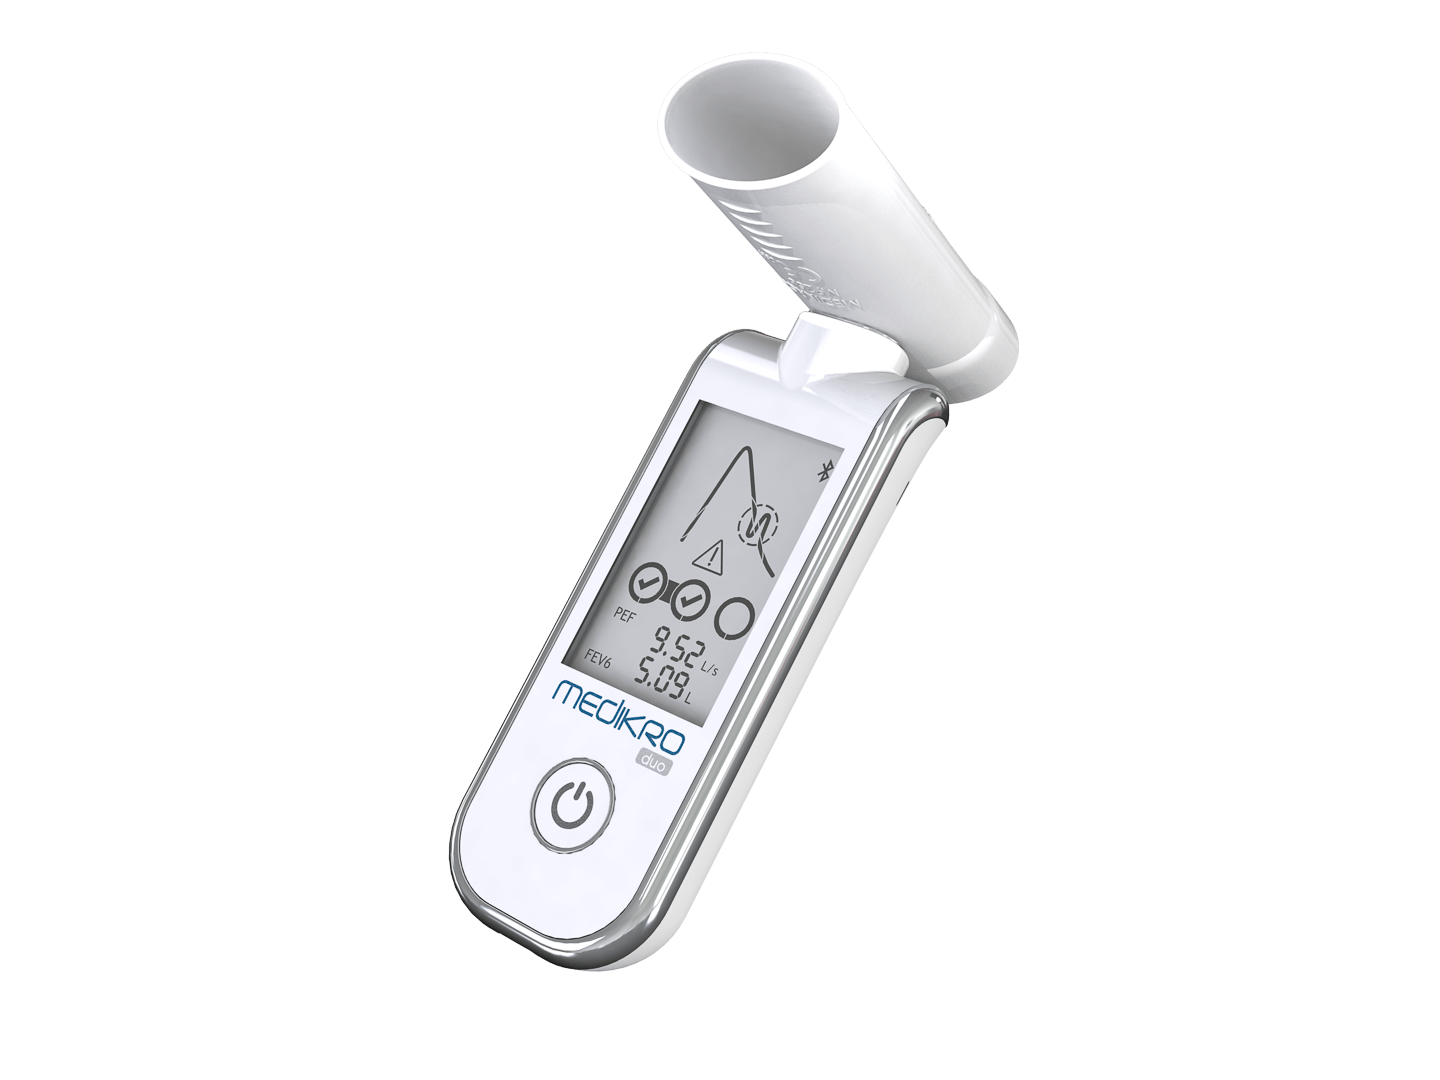
What is a spirogram?
A spirogram is an illustrative graph that plots the volume of air your lungs can hold against the flow rate at which you inhale or exhale. The graph presents a curve that reflects the dynamic process of breathing: the peak represents the maximum speed of your exhale (PEF), and the area under the curve corresponds to the volume of air expelled (FVC) and the speed of exhalation in the first second (FEV1).

How is a spirogram being interpreted?
Spirogram is reflecting your breathing patterns throughout the spirometry test. The shape of the curve on the graph is instrumental in diagnosing specific lung conditions:

- A normal spirometry graph is characterized by a rapid rise in airflow, peaking quickly before a gradual decline. This indicates efficient lung function where air is expelled swiftly and fully.
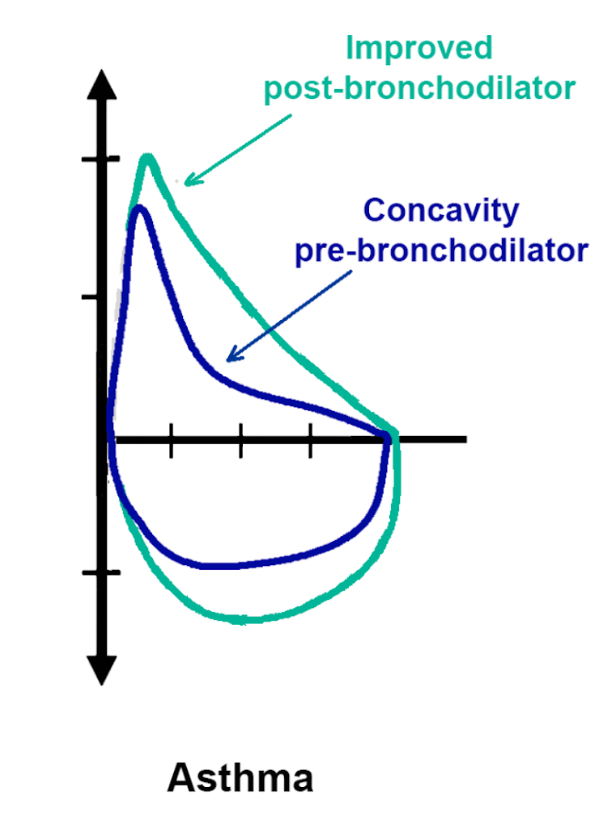
- In contrast, an obstructive pattern may show a ‘coved’ or scooped-out shape on the flow-volume loop. This pattern is marked by a reduced peak flow and a concave curvature after the peak, signaling airway obstruction that hinders air expulsion. If your FEV1/FVC ratio falls below 70%, it’s a sign of such an obstructive respiratory condition, like asthma or COPD, suggesting partially blocked airways.
- Restrictive patterns exhibit a different spirometry graph with a sharp but lower peak, pointing to a reduced lung volume. The steeper descent to baseline reflects a reduced ability to fill the lungs with air, but not necessarily an issue with expelling it. A below-normal FVC value corroborates this, hinting at restrictive respiratory conditions such as pulmonary fibrosis or scoliosis, where lung expansion is compromised.
Case example can help illustrate the implications of different spirometry results. For instance, an individual with asthma might show a significantly reduced FEV1 during an exacerbation 6, which improves with bronchodilator treatment:
What is “normal”?
Understanding your spirometry results in the context of what’s considered normal for your demographic is essential. ‘Normal’ spirometry values are determined by various factors, including age, sex assigned at birth, height, and ethnicity 7. To accurately interpret your results, they must be compared against predicted normal values that are specific to these demographic variables.
Medikro Spirometry software addresses this by integrating a database of reference sets, which are essentially collections of healthy individuals’ spirometry measurements across different ethnic backgrounds, ages, and sexes. Before conducting the test, your doctor will select a reference set that matches your demographic profile. The software then uses this information to determine if your spirometry results deviate from what is expected within your peer group.
Results that fall below normal can signal a potential impairment in lung function and may prompt further medical exploration or the initiation of a treatment plan. While results that exceed normal parameters are typically not a cause for concern, they should still be reviewed by your healthcare provider to ensure a thorough understanding of your lung health.
By aligning individual spirometry results with the most appropriate reference sets, Medikro Spirometry software simplifies the complexity of personalized assessments. This not only ensures precision but also streamlines the process, enhancing the overall quality of respiratory care. In essence, it embodies our ethos: ‘Spirometry Simplified’ — making an intricate process more accessible and accurate for both practitioners and patients.
Factors influencing spirometry test results
Several factors can affect the accuracy of your spirometry test results:
- Test technique and effort: proper technique and maximal effort are essential for reliable results.
- Health conditions: temporary health issues like respiratory infections can impact your test outcomes.
- Environmental Factors: exposure to pollutants or allergens before testing can alter results.
FAQs on Interpreting Spirometry Results
- Can spirometry test results improve over time? Yes, with appropriate treatment 8 and lifestyle changes 9, your lung function can improve, reflected in future spirometry tests.
- What should I do if my results indicate a problem? Discuss your results with your healthcare provider to understand the implications and next steps, including potential further testing or treatment adjustments.
- How can I ensure accurate spirometry test results? Follow pre-test instructions carefully, ensure you’re in good health at the time of testing, and perform the test with maximal effort.
Conclusion
Interpreting spirometry test results is a nuanced process that requires considering the entire clinical picture, including symptoms, medical history, and other diagnostic tests. It’s essential to have an open and informed discussion with your healthcare provider about what your spirometry test results mean for your health.
1. Derom, E., Weel, C., Liistro, G., Buffels, J., Schermer, T., Lammers, E., Wouters, E., & Decramer, M. (2008). Primary care spirometry*. European Respiratory Journal, 31, 197 – 203. https://doi.org/10.1183/09031936.00066607.
2. Spahn, J., Cherniack, R., Paull, K., & Gelfand, E. (2004). Is forced expiratory volume in one second the best measure of severity in childhood asthma?. American journal of respiratory and critical care medicine, 169 7, 784-6 . https://doi.org/10.1164/RCCM.200309-1234OE.
3. “FVC is a reliable, valid, and responsive measure of clinical status in patients with idiopathic pulmonary fibrosis, and a decline of 2-6% represents a clinically important difference.” Bois, R., Weycker, D., Albera, C., Bradford, W., Costabel, U., Kartashov, A., King, T., Lancaster, L., Noble, P., Sahn, S., Thomeer, M., Valeyre, D., & Wells, A. (2011). Forced vital capacity in patients with idiopathic pulmonary fibrosis: test properties and minimal clinically important difference.. American journal of respiratory and critical care medicine, 184 12, 1382-9 . https://doi.org/10.1164/rccm.201105-0840OC.
4. “A fixed FEV1/FVC ratio of 0.70 may identify at-risk patients, even among older adults, with increased risk of death and COPD-related hospitalizations.” Mannino, D., Buist, A., & Vollmer, W. (2006). Chronic obstructive pulmonary disease in the older adult: what defines abnormal lung function?. Thorax, 62, 237 – 241. https://doi.org/10.1136/thx.2006.068379.
5. Persoon, E., & Fu, K. (1977). Shape Discrimination Using Fourier Descriptors. IEEE Transactions on Pattern Analysis and Machine Intelligence, PAMI-8, 388-397. https://doi.org/10.1109/TSMC.1977.4309681.
6. “An increase in airway inflammation is an early feature of a mild exacerbation of asthma, which can lead to a fall in FEV1 by 320 ml.” Gibson, P., Wong, B., HEPPERLE, M., Kline, P., Girgis-Gabardo, A., Guyatt, G., Dolovich, J., DENBURG, J., Ramsdale, E., & HARGREAVE, F. (1992). A research method to induce and examine a mild exacerbation of asthma by withdrawal of inhaled corticosteroid. Clinical & Experimental Allergy, 22. https://doi.org/10.1111/j.1365-2222.1992.tb00161.x.
7. “Caucasians have higher mean FVC and FEV1 values than Mexican-Americans and African-Americans across the age range, with African-Americans having lower values, possibly due to body build differences.” Hankinson, J., Odencrantz, J., & Fedan, K. (1999). Spirometric reference values from a sample of the general U.S. population.. American journal of respiratory and critical care medicine, 159 1, 179-87 . https://doi.org/10.1164/AJRCCM.159.1.9712108.
8. “Intensive medical therapy led to significant improvements in forced vital capacity (FVC) and forced expiratory volume in 1 second (FEV1) in patients with severe heart failure.” Faggiano, P., Lombardi, C., Sorgato, A., Ghizzoni, G., Spedini, C., & Rusconi, C. (1993). Pulmonary function tests in patients with congestive heart failure: effects of medical therapy.. Cardiology, 83 1-2, 30-5 . https://doi.org/10.1159/000175944.
9. “Over an 8-year follow-up, most adults who reduced their body mass index values also increased their lung function.” Bottai, M., Pistelli, F., Pede, F., Carrozzi, L., Baldacci, S., Matteelli, G., Scognamiglio, A., & Viegi, G. (2002). Longitudinal changes of body mass index, spirometry and diffusion in a general population. European Respiratory Journal, 20, 665 – 673. https://doi.org/10.1183/09031936.02.01282001.